
Did We Just Bottom? (Update: Election Week, BTC and the Dow)
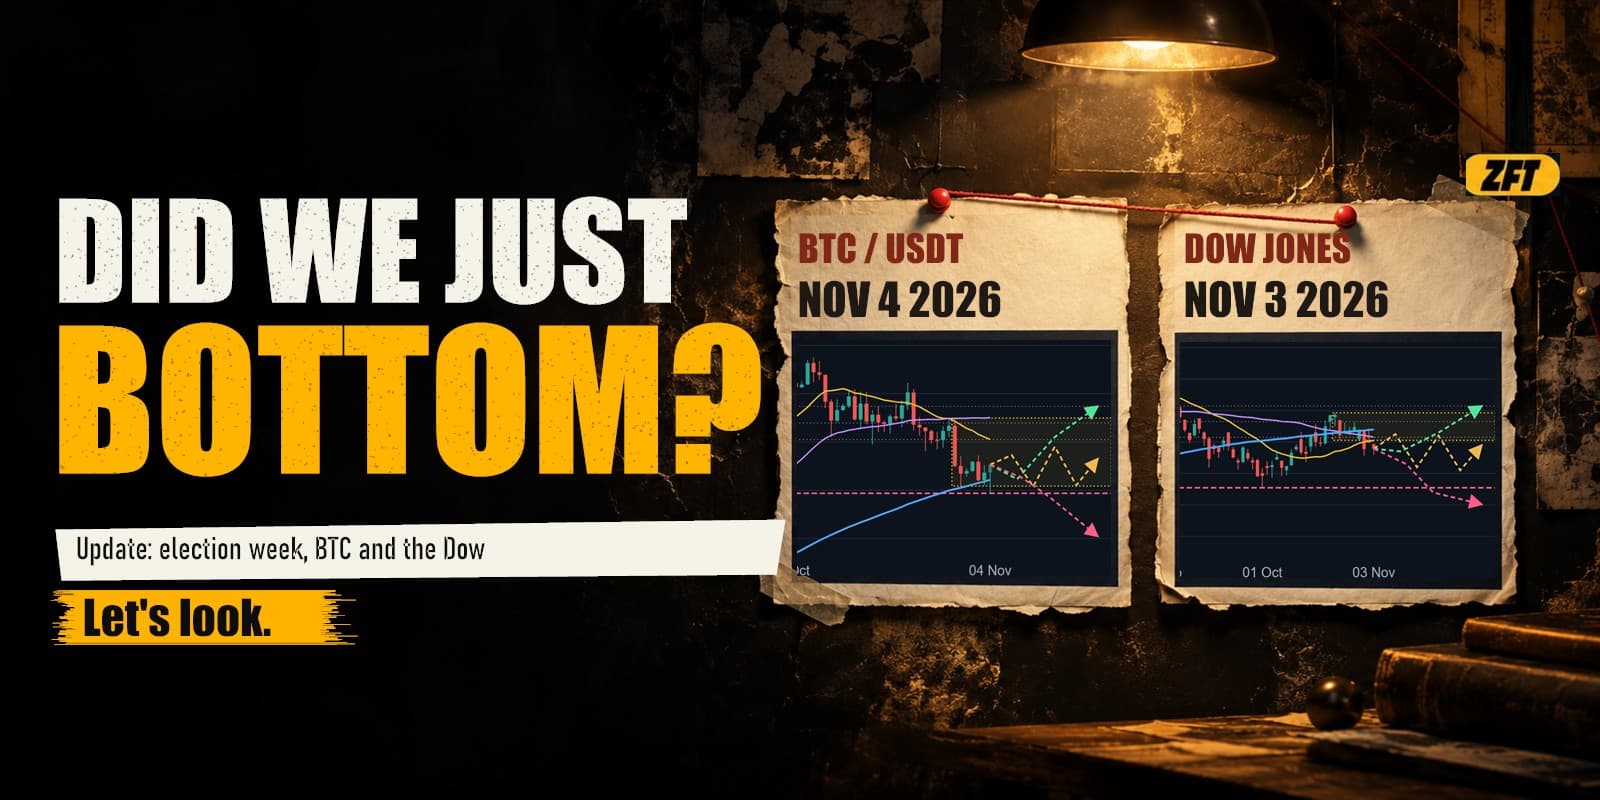
Everyone's bearish.
Timelines are full of "it's over." Somebody's tita just asked if crypto is dead. 😂
That's usually the mood near a bottom. Not always. Usually.
UPDATE (NOVEMBER 4): ELECTION WEEK, BTC AND THE DOW
Last week I wrote that Bitcoin lost its October floor and was testing its 100-day moving average. This is the follow-up. The US midterms were yesterday, November 3, and I've been asked the same question all week: did we just bottom?
I don't know. Nobody does. But I can show you what I'm looking at, what would make me right, and what would make me wrong. This time I added the Dow, because the stock market is in the same mood.
THE 100-DAY TEST: STILL STANDING (SO FAR)
In the last post, BTC dipped to its 100-day moving average and I said it was a decision point.
Here's what happened next on Binance:
October 30: closed at 77,369.
November 2: closed at 76,816.
November 3: closed at 77,454.
The daily SMA100 has been rising the whole time, and it's now around 76.7K. Every daily close since the October 29 break has stayed above it. November 2 was close: about 230 dollars above.
This morning, BTC wicked to 75,736. That's below the bottom of the Darvas box (76,326, the October 30 low). And then it bounced back to about 78,110 as I write (Binance, 05:51 UTC, 1:51 PM Manila).
A wick is noise. A daily close is the market committing. So far, the market hasn't committed to going lower.
WHAT THE MOOD SAYS
Crypto Fear & Greed is at 34, "Fear" (alternative.me, November 4). A week ago it was 51. A month ago, 70.
CNN's Fear & Greed for US stocks is at 19.1, "Extreme Fear" (as of 9 AM Manila today). A week ago it was 34.4.
That's a lot of fear for a market that's down about 11% from its September high on BTC, and about 5% from its August high on the Dow.
To me it feels like semi-capitulation. People aren't panic-selling anymore. They're just tired.
The posts aren't "SELL EVERYTHING" now. They're "I'm not even checking anymore." That's a different kind of bearish.
WHY ELECTION WEEK MATTERS
Big scheduled events make markets jumpy until they pass. Once they pass, the uncertainty goes away, whoever won.
So I checked what the S&P 500 did after every US midterm election since 1950 (Yahoo Finance daily closes, from the close on election day):
6 months later, it was higher 19 times out of 19.
12 months later, it was higher 19 times out of 19.
The median: about +17% after 6 months and +14% after 12.
Only the last 40 years (1982–2022, 11 midterms)? Still 11 out of 11, at both 6 and 12 months.
The Dow tells a similar story, with a shorter history in my data (1994–2022, 8 midterms): higher after 12 months all 8 times, and after 6 months 7 times. The miss was 2002, at -1.7%.
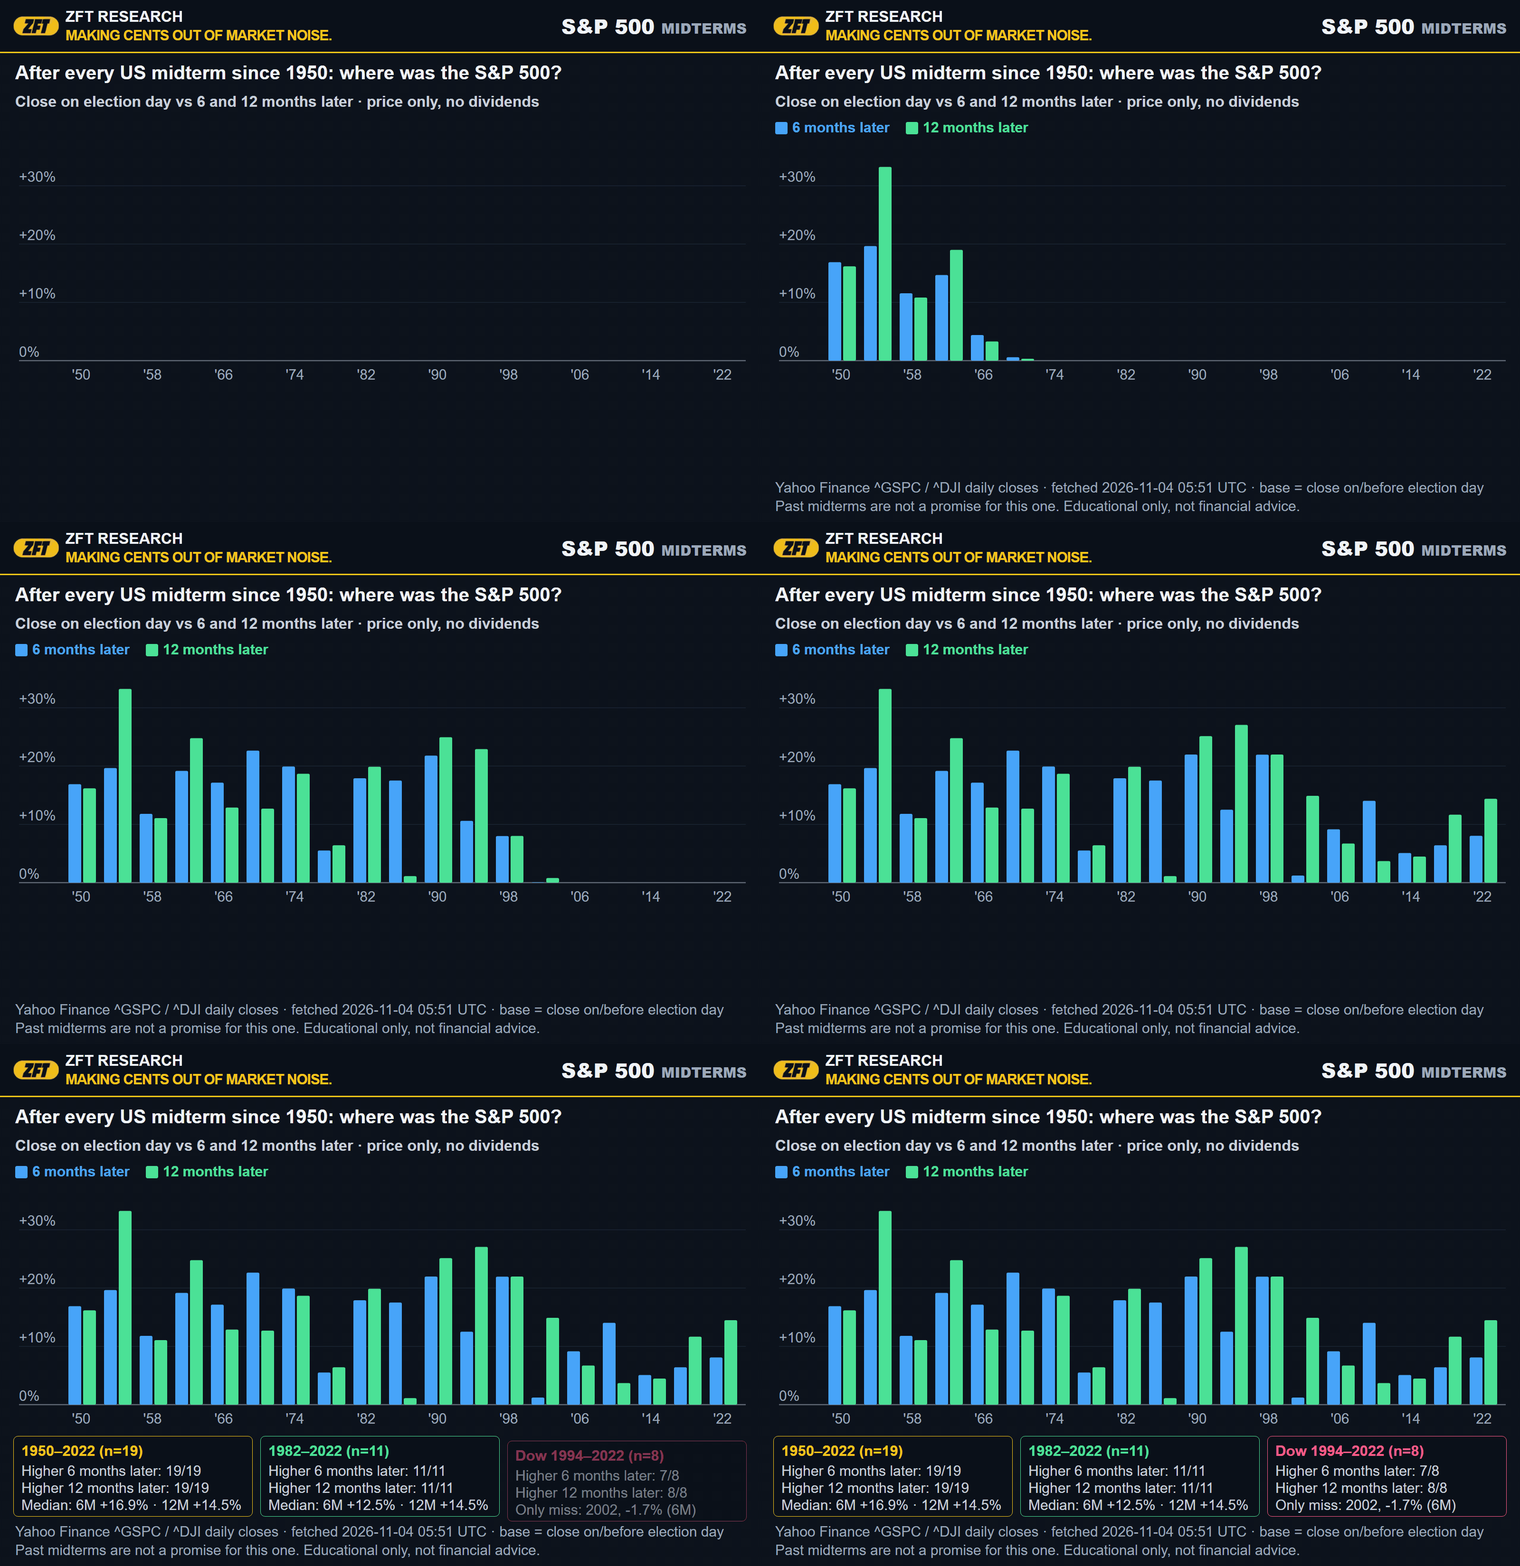
Now the honest part. 19 out of 19 sounds like a law of physics. It isn't. It's 19 data points across 72 years, in very different economies. And the short term is messier: one month after the midterm, the S&P was higher only 8 times out of 11 since 1982.
History rhymes. It doesn't sign contracts.
THE BTC SCENARIO MAP
Same chart style as last week. The new parts are the 20, 50 and 100-day moving averages, the Darvas box and the Fibonacci levels from the September high.
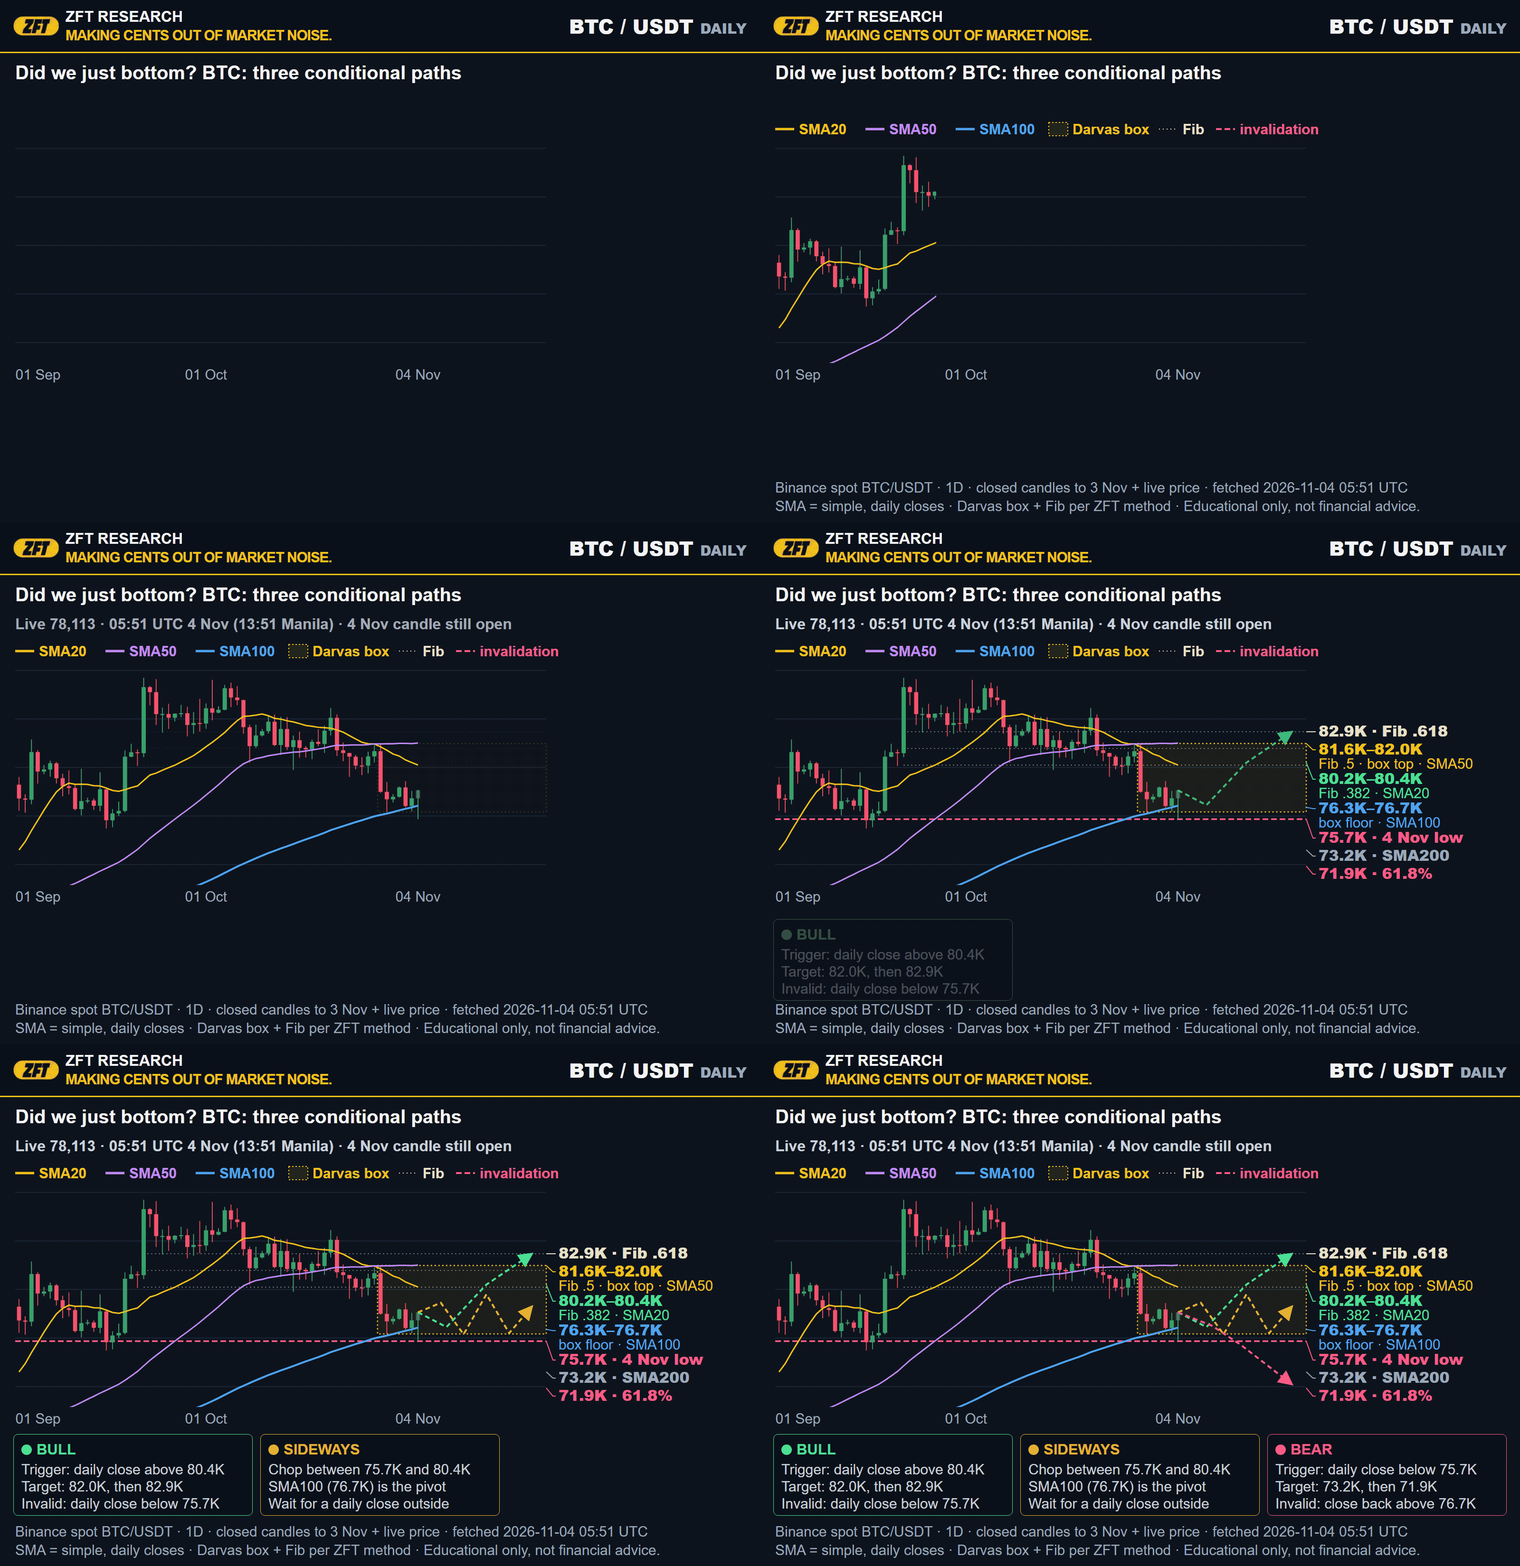
🟢 Bull: BTC closes a day back above 80.4K. That's where the 20-day average and the 38.2% Fib sit together. Next up is 81.6K to 82.0K, where the 50% Fib, the top of the box and the 50-day meet, then 82.9K. If that happens, the bottom might really be in. Invalidation: a daily close below 75.7K.
🟡 Sideways: chop between 75.7K and 80.4K, with the 100-day around 76.7K as the pivot. Boring. And boring is where most people lose money by trading too much. Patience pays here.
🔴 Bear: a daily close below 75.7K, today's low. That breaks both the box and the 100-day. Next stop, the 200-day around 73.2K, then 71.9K, the 61.8% retracement of the August to September run. I'm wrong, and I adjust.
THE DOW SCENARIO MAP
The Dow closed at 51,786.72 on November 3 (Yahoo Finance). It's below its 20, 50 and 100-day averages, and it already broke out of the bottom of its last Darvas box on October 30. But it's still about 2.5% above its October 1 low, and above its 200-day.
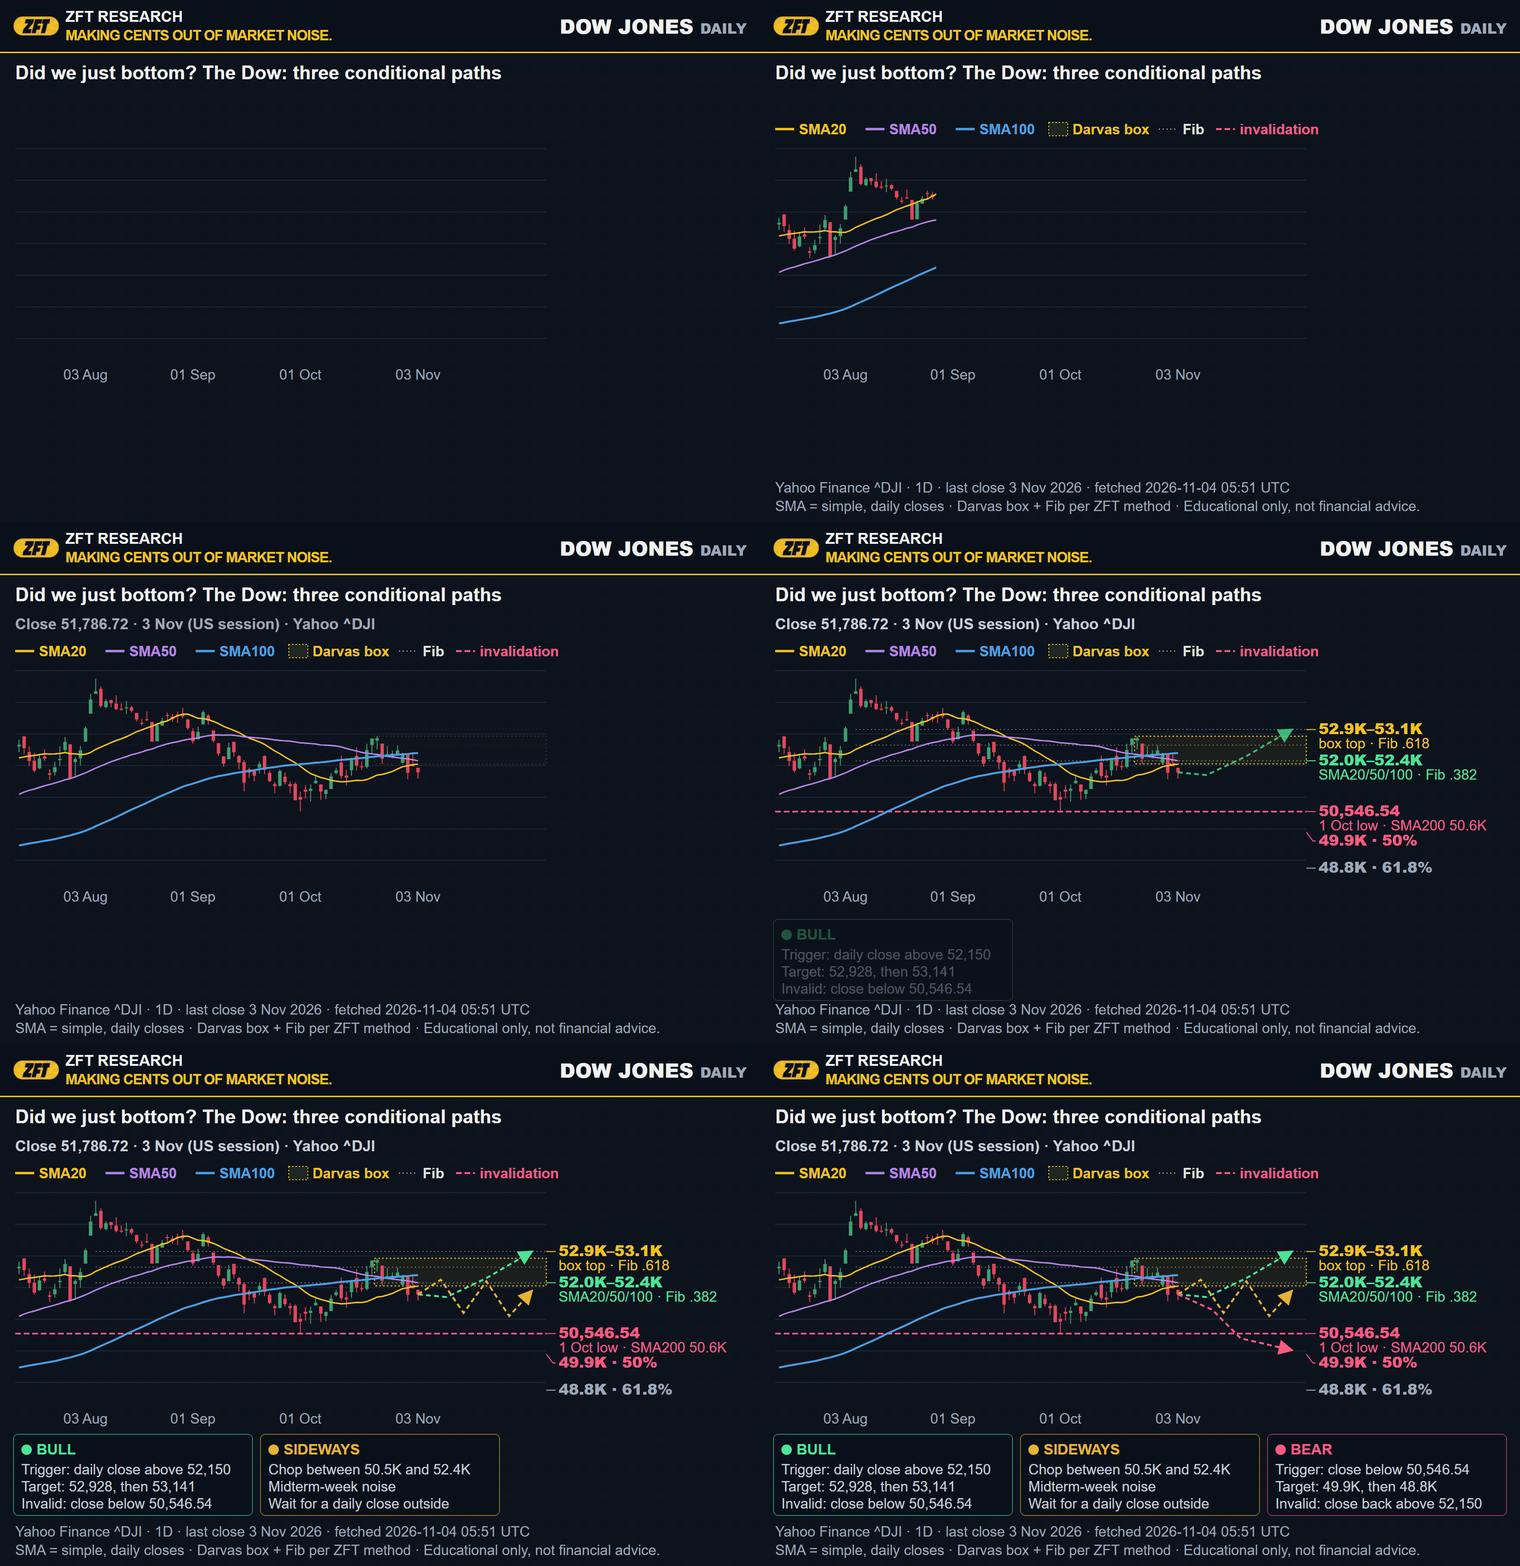
🟢 Bull: a daily close back above 52,150, where the 38.2% Fib and the 50-day average sit. Then 52,928 (the top of the box) and 53,141.
🟡 Sideways: chop between about 50.5K and 52.4K while the midterm news settles.
🔴 Bear: a daily close below 50,546.54, the October 1 low. Then 49.9K and 48.8K, the 50% and 61.8% retracements of the March to August rally.
My invalidation for the bullish view on the Dow: a daily close below 50,546.54.
MY HONEST TAKE
I'm bullish. For me, the elections are the catalyst.
This could be hopium. But I'm taking my chances.
Prices don't go straight down in a line. If it goes up and keeps going, this is potentially a generational entry.
And if I'm wrong, the levels above tell me exactly when. That's the difference between a thesis and a hope: one of them has an exit written down.
FULL DISCLOSURE
I'm still underwater on several positions. I'm waiting for a good price to exit those.
I'm also personally buying the US index at these levels, and I already did earlier.
I'm not here to flex, just to share what I see.
That's not a recommendation for you to do the same. My timeline, my capital and my risk tolerance are mine. Yours are yours.

IF YOU'RE TRADING THIS WEEK
Weeks like this are when fees pile up fastest. Use our referral code here to get 20% off your OKX trading fees, especially during these volatile times: https://www.okx.com/join/OFF2O
And whatever you trade: size small, use a stop, and know your exit before you enter.
NOW THE BAD NEWS
Sentiment can stay fearful for a long time. "Extreme Fear" isn't a buy signal. It's a mood.
Midterm history is about US stocks. BTC wasn't around for most of those 19 midterms, so there's no long record that says crypto follows.
The bounce off 75.7K happened on an open daily candle. It can still close lower today.
And "generational entry" only looks generational in hindsight. In real time, it looks exactly like this: scary, boring and confusing.
MY SIMPLE "DID WE BOTTOM?" CHECKLIST
Did price close a day above the first real level (80.4K on BTC, 52,150 on the Dow)?
Did it hold the line I said would prove me wrong (75.7K and 50,546.54)?
Is the 100-day still rising under BTC?
Am I sizing this so I can survive being wrong?
Am I reacting to the timeline, or planning around the level?
If this is hopium, do I know my exit before I inhale?
THE MAIN POINT
Bottoms don't ring a bell. They feel like this week.
Everyone's tired, the news is loud, and the chart is doing something boring at a level that matters.
I'm taking my chances, with my invalidation written down. You don't have to agree. Just have a plan either way.
These are my own thoughts. Not financial advice. Do your own research and size your positions properly.
For educational purposes only. Not a buy or sell call. The market has already tested your patience this month; don't let a blog post test your risk rules.
Kind Regards,
Zeefreaks