
How to Spot the Next Market Outlier
Everybody loves the underdog.
The market usually does not.
Everybody likes a comeback story. The forgotten team. The rejected player. The company everybody laughed at. The coin that fell 95% and somehow crawls back from the grave.
Great movie.
Great documentary.
Great motivational speech.
Not automatically a great trading strategy.
In trading, I would rather own the star player than spend the entire season praying that the benchwarmer suddenly becomes Michael Jordan.
I think part of the reason people are attracted to wrecked assets is psychological.
We love the underdog because the comeback story feels personal. We see ourselves in it. We want the thing everybody gave up on to prove everybody wrong.
That is very human.
But your portfolio is not a therapy session.
The market does not pay you extra because your investment had character development.
This leads to one of the principles I keep coming back to in ZFT:
Whenever possible, PICK THE OUTLIER.
An outlier is the asset that refuses to behave like everyone else.
When the market is weak, it is unusually strong.
When everyone is getting dumped, it falls less, recovers faster, makes higher lows, keeps attracting activity, or sometimes just continues doing its own thing like nobody sent it the bear-market memo.
That does not mean every outlier becomes a home run.
It means the outlier has already passed a stress test that most of its peers failed.
The Bear Market Is the Tryout. The Bull Market Is Game Day.
Anybody can look strong when liquidity is everywhere.
In a bull market, even mediocre assets can put on a cape.
That is exactly why I pay attention to what happens when conditions are terrible.
A bear market removes the easy mode.
Capital becomes selective.
Weak narratives lose attention.
Speculators disappear.
Bad tokenomics become obvious.
Companies with weak balance sheets get exposed.
Protocols with no real users suddenly discover that vibes are not revenue.
So when one asset keeps showing relative strength while the rest of the field looks like it needs medical attention, I want to know why.
Three Reasons Bear-Market Outliers Deserve Attention
1. Demand Survived the Stress Test
If buyers are still willing to support an asset when the market is hostile, that is information.
It can mean:
The business is still growing
Users are still showing up
Cash flow is still improving
The product still matters
Market share is expanding
The market believes the asset deserves a premium to its peers
You are not looking for perfection.
You are looking for evidence that the market tried to break it and could not break it as badly as everything else.
2. It Starts the Next Race With a Head Start
An asset down 90% needs a 900% gain just to get back to where it started.
An asset that held flat, lost only 20%, or recovered early does not have the same hole to climb out of.
That matters.
The first asset may spend half the next bull market repairing damage.
The outlier may already be attacking new highs.
3. Strength Attracts More Strength
When liquidity comes back, traders scan for leadership.
Funds look for relative strength.
Momentum systems look for breakouts.
Retail notices what is making new highs.
That can create a feedback loop:
Strong fundamentals → Strong price action → More attention → More liquidity → Stronger price action
And remember:
An outlier does not need to be green during a bear market.
Falling 30% while the rest of your peer group falls 80% is still massive relative strength.
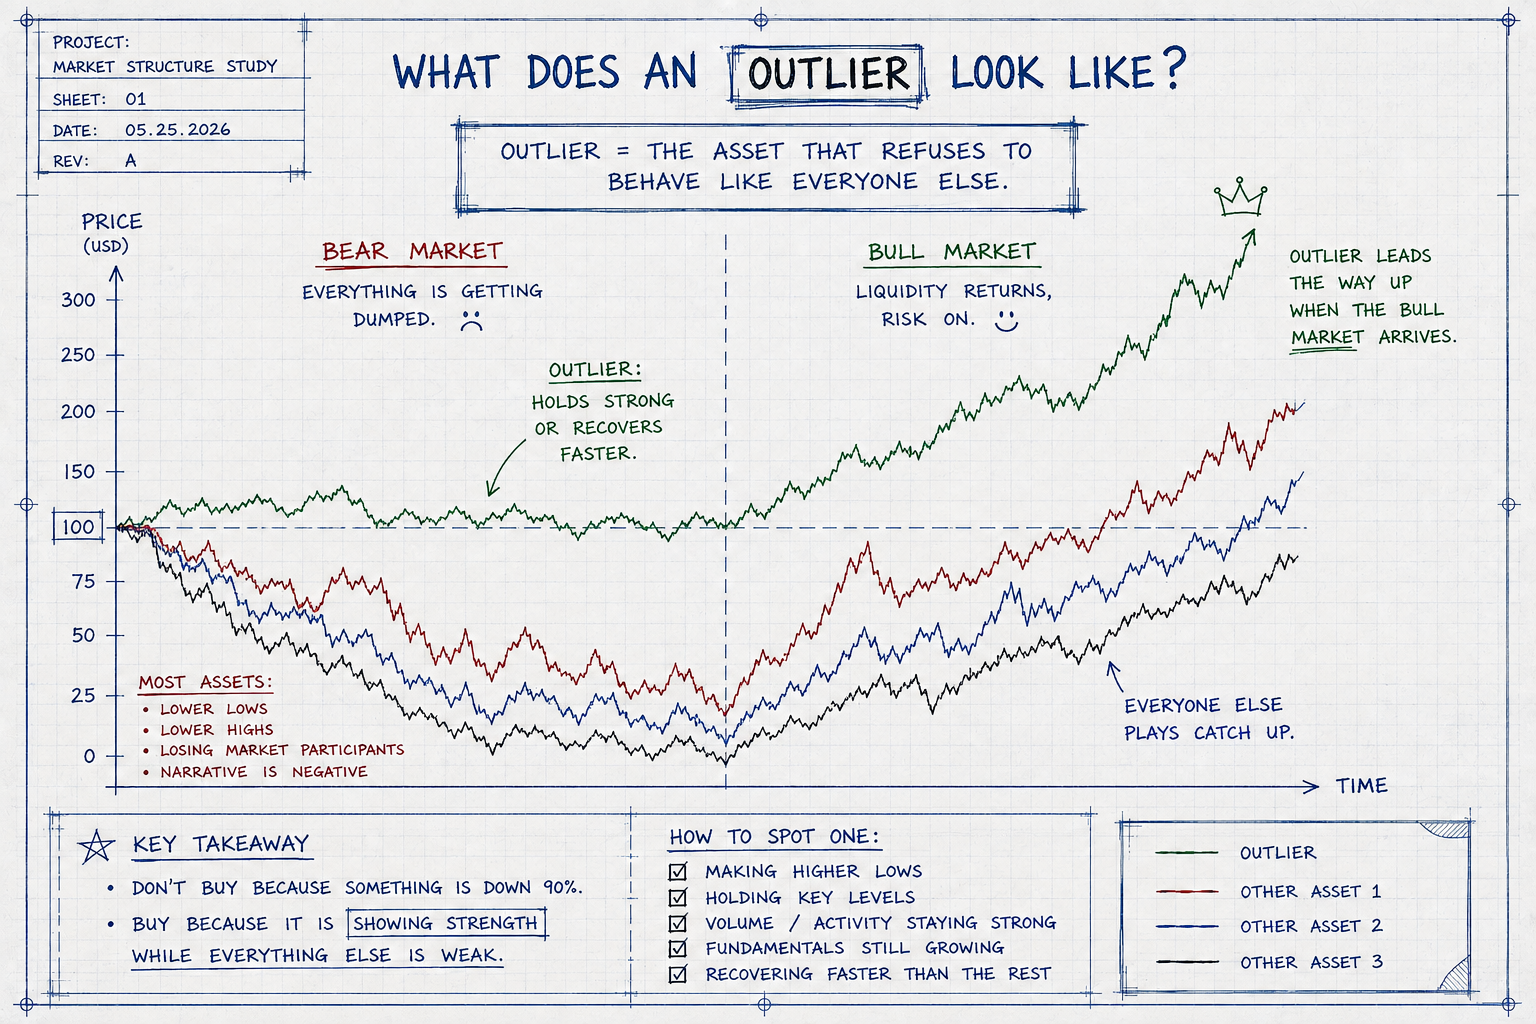
Imagine the entire market falling.
Most assets are:
Making lower lows
Breaking support
Losing participants
Losing volume
Losing narratives
But one asset behaves differently.
It holds important levels.
It makes higher lows.
It recovers faster.
Activity stays strong.
Fundamentals continue improving.
Then, when the bull market finally arrives, that asset is not starting from the bottom with everybody else.
It already has a head start.
That is the idea.
Do not buy something simply because it is down 90%.
Study the thing that is showing strength while everything else is weak.
Historical Scoreboard: What Did the Actual Outliers Look Like?
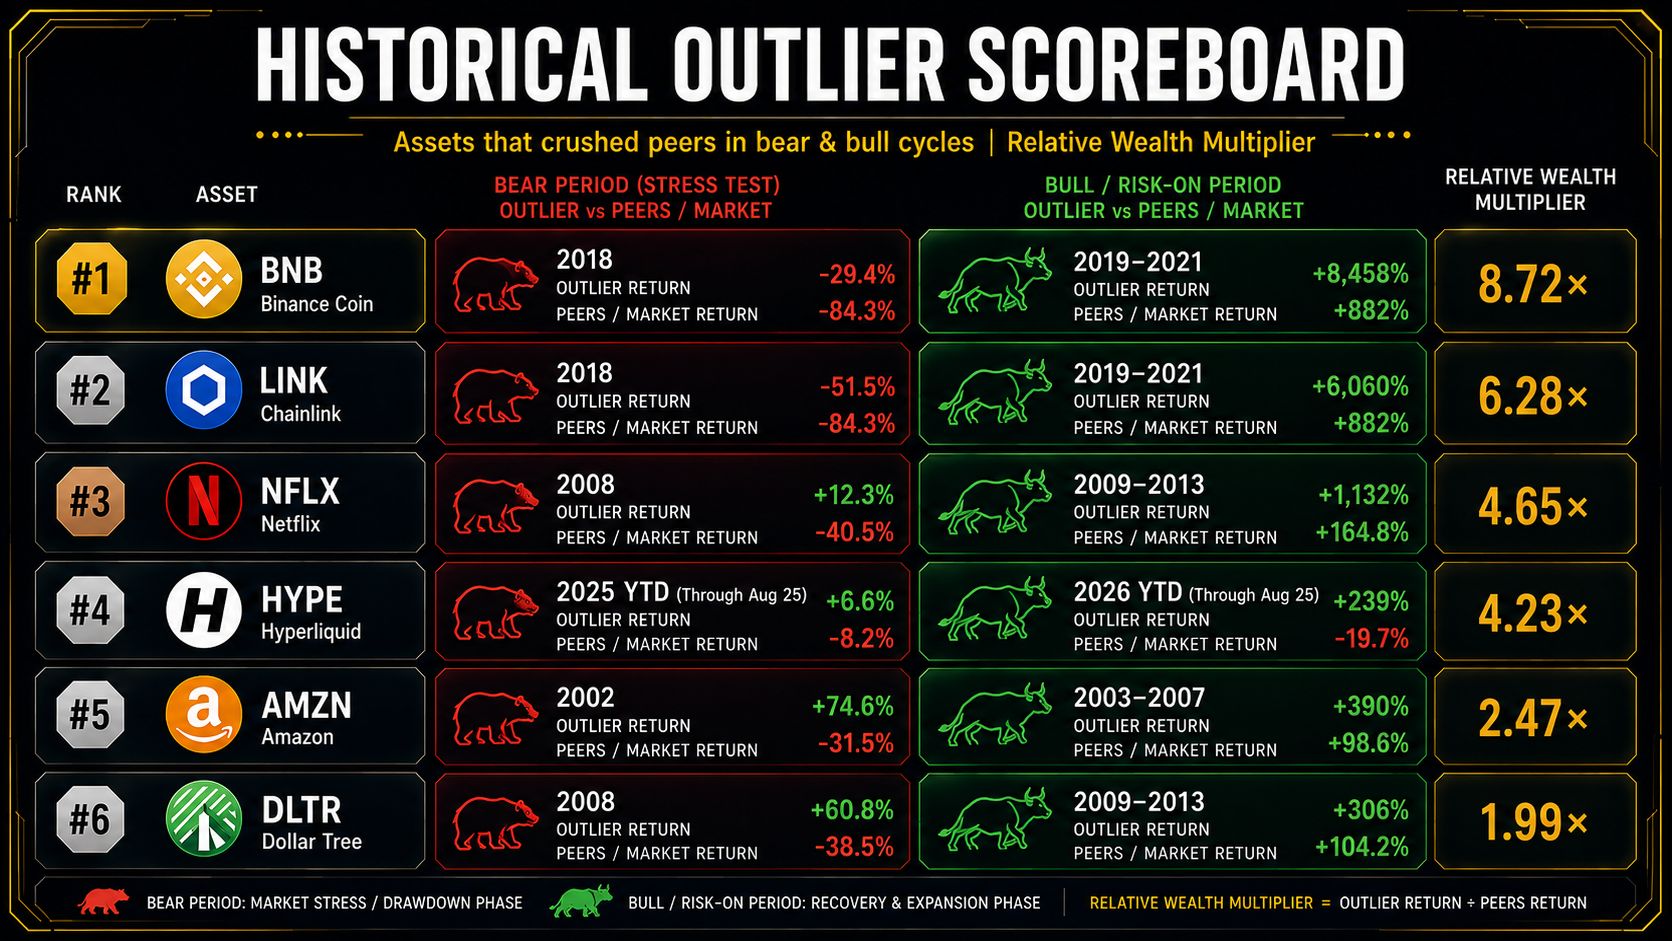
To make the comparison more useful, I compared each asset against a relevant benchmark during the weak period and then measured how much wealth each created relative to that benchmark during the following risk-on phase.
Here's the key question:
If the outlier and the benchmark both started with 1 unit of capital, how many times more ending wealth did the outlier create?
Case Studies: Stocks
Amazon: The Dot-Com Market Was Still Ugly. Amazon Was Already Running.
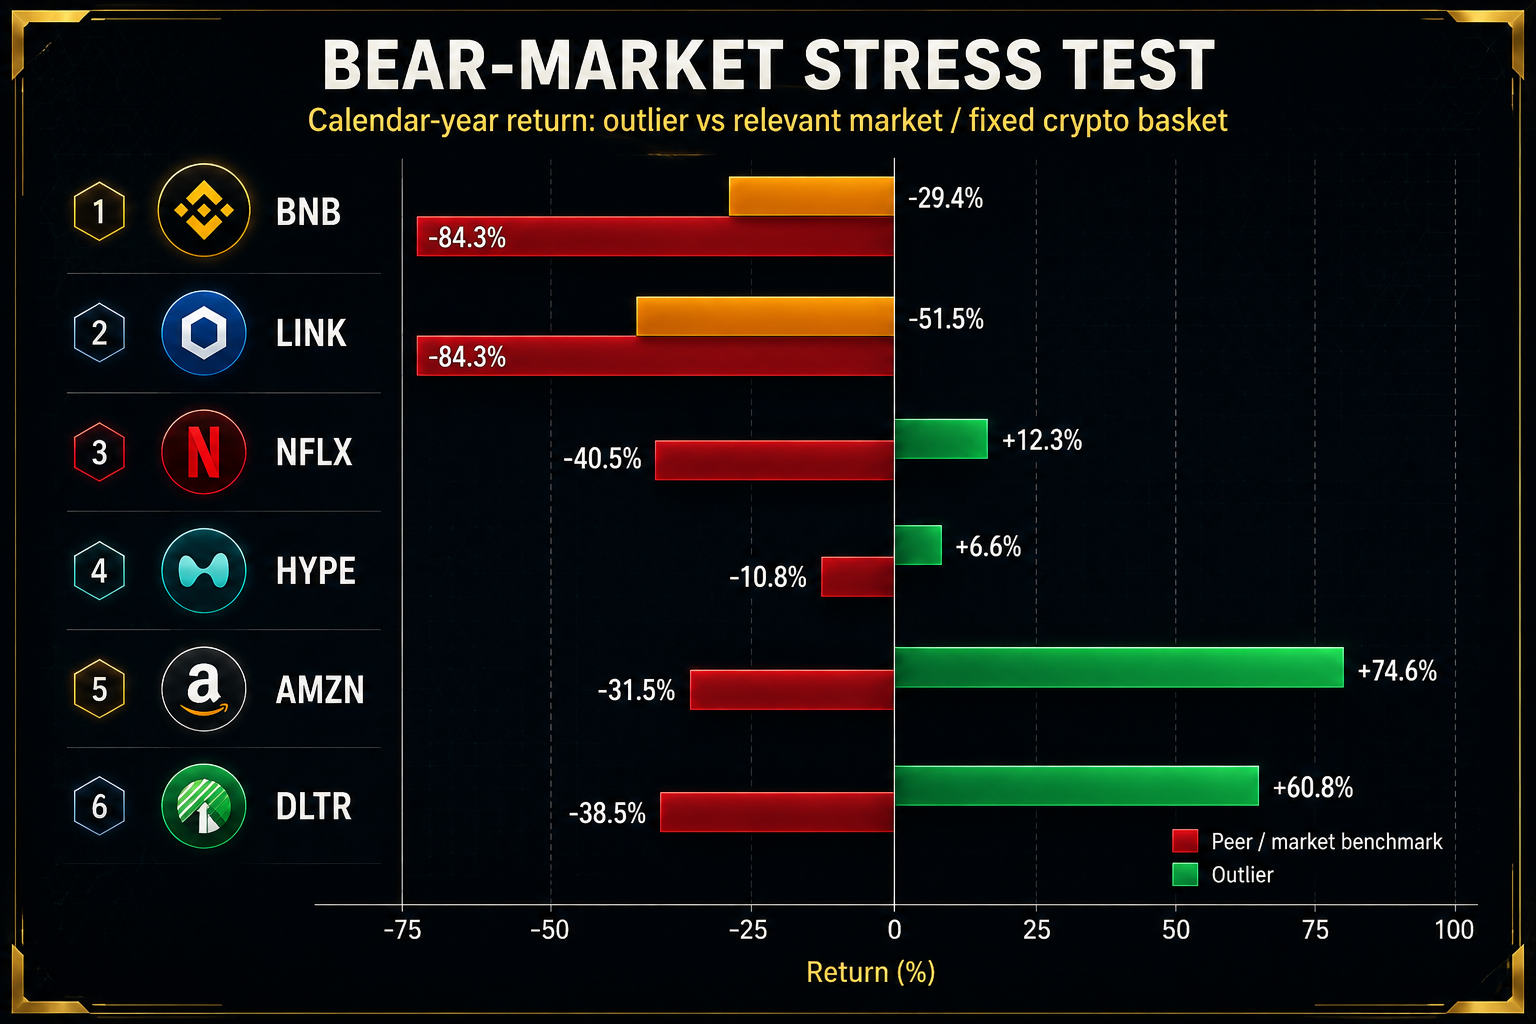
In 2002, the Nasdaq Composite fell about 31.5%.
Amazon did the opposite.
AMZN gained approximately 74.6%.
That is not a small difference.
That is the market putting a giant yellow highlighter over one name and saying:
“Maybe study this one.”
Then from 2003 through 2007, AMZN compounded to roughly +390%, versus about +99% for the Nasdaq.
It did not win because it was the most beaten-down internet stock.
It won because the business and the market were already telling you it was one of the survivors with real scale.
Netflix: Green During the Global Financial Crisis
2008 was not exactly a friendly year for risk assets.
The Nasdaq lost roughly 40.5%.
Netflix gained approximately 12.3%.
Then from 2009 through 2013, NFLX compounded roughly +1,132%, versus about +165% for the Nasdaq.
A 1-unit investment became approximately 12.3 units.
The benchmark became roughly 2.65 units.
That is a relative wealth multiple of approximately 4.65x.
The point is not that Netflix never experienced ugly drawdowns afterward.
It absolutely did.
The point is that during a period when most investors were busy trying not to vomit into their keyboards, Netflix was already displaying leadership.
Dollar Tree: Boring Can Still Be an Outlier
Not every outlier needs a sexy narrative.
Dollar Tree gained roughly 60.8% in 2008, while the S&P 500 price index fell approximately 38.5%.
From 2009 through 2013, DLTR then compounded another roughly +306%, versus approximately +105% for the S&P 500 price index.
That is an important reminder:
Outlier does not mean hype.
It means unusual strength relative to the environment.
Sometimes the star player is a boring defensive retailer quietly eating market share while everybody is staring at the flashy stuff.
Important Note:
Relative strength is a clue, not a buy button.
After finding the outlier, you still investigate valuation, fundamentals, liquidity, catalysts, and what could invalidate the thesis.
Case Studies: Crypto
Crypto makes the outlier effect look like it drank three espressos.
The same idea becomes more dramatic in crypto because the dispersion is ridiculous.
During the 2018 crypto winter, a fixed basket of BTC, ETH, XRP, BCH, and LTC lost an average of approximately 84.3%.
BNB: -29% Looked Terrible Until You Looked Around
BNB fell approximately 29.4% in 2018.
Nobody frames a 29% loss as a victory at dinner.
But context matters.
The major-coin basket was down roughly 84%.
Then from 2019 through 2021, BNB compounded approximately +8,458%.
The same peer basket averaged approximately +882% cumulatively.
BNB therefore created roughly 8.72x the ending wealth of the benchmark basket during that risk-on period.
And there was a reason behind the strength.
Binance was growing.
BNB utility was expanding.
The token was developing a structural ecosystem around it.
Price strength had a reason.
LINK: The Market Was Quiet. LINK Was Not.
Chainlink fell approximately 51.5% in 2018.
Again, ugly in isolation.
But compared with an 84.3% average collapse across the major-coin basket, it was relatively resilient.
Then came 2019:
Approximately +500%.
Then 2020:
Approximately +522%.
By the end of 2021, LINK's cumulative 2019–2021 move was around +6,060%.
This is one of the cleanest examples of why I like watching relative strength during ugly markets.
The entire asset class does not need to be bullish yet.
Sometimes the future leader starts acting bullish first.
HYPE: The Live Experiment
HYPE is different because this cycle is still happening.
We do not have the luxury of looking at a finished chart and pretending everything was obvious.
In 2025, HYPE finished roughly +6.6%, while an equal-weight basket of BTC, ETH, BNB, XRP, and SOL averaged approximately -10.8%.
The document also notes that total crypto market capitalization ended 2025 down approximately 10.4% year over year.
Then, through late August 2026, HYPE was approximately +239% YTD, while that same major-coin basket averaged about -19%.
But what matters to me is not simply the price performance.
There is a fundamental explanation behind the strength.
Hyperliquid built a high-activity derivatives venue, while its Assistance Fund created structural HYPE demand through buybacks.
The research in this report cites an estimate of more than $644 million spent on HYPE buybacks during 2025, purchasing more than 21 million tokens.
That is the kind of thing I want to see when price is outperforming:
A reason.
Revenue.
Usage.
Market share.
Token demand.
Product-market fit.
Something stronger than a Telegram admin typing:
“Big things coming.”
LIVE CASE
HYPE has passed the relative-strength test so far.
It has not yet passed the completed-cycle test.
Treat it as a current case study, not proof that the future is guaranteed.
As of this writing HYPE is currently Trading at All Time Highs.
Why People Still Pick the Underdog
This is the funny part.
Even when the star player is standing right in front of us, people still want the underdog.
Why?
Because the underdog feels like more upside.
“This one is down 95%. If it just goes back to the old high, I make 20x.”
But the old high is not a legal obligation.
The market is not required to return your bag to its previous emotional support level.
We also like comeback stories because they reflect something we understand personally:
Struggle.
Rejection.
Being underestimated.
Proving people wrong.
That is beautiful in life.
In markets, however, I do not need my asset to have suffered enough to deserve success.
I need it to make money.
In movies, root for the underdog.
But in your portfolio? Bet on the MVP.
The ZFT Outlier Playbook
How to Hunt for Outliers
Finding an outlier is the start of the research process
Here is the checklist I would use.
1. Compare It Against the Right Field
Do not say a coin is strong because it is up 10% if the entire sector is up 40%.
Relative strength only means something when the comparison makes sense.
Compare stocks with their index or industry.
Compare tokens with a fixed basket of relevant majors or sector peers.
2. Ask Why It Refuses to Die
Price strength without an explanation can simply be:
A squeeze
Thin liquidity
Low float
Manipulation
A temporary narrative
Look for evidence underneath the price:
Revenue growth
User growth
Market share
Cash flow
Balance-sheet improvement
Protocol fees
Buybacks
Adoption
A genuine catalyst
3. Look for Structure, Not One Heroic Candle
Things I want to see:
Higher lows while peers keep making lower lows
Faster recoveries after market-wide selloffs
Holding important levels while peers lose them
Persistent volume or activity instead of a one-day pump
New highs before the broader market starts feeling euphoric
4. Build the Position. Do Not Worship the Entry.
You do not need the exact bottom.
I repeat:
You do not need the exact bottom.
If the thesis is strong but volatility is high, build in tranches.
Let the market prove more of your thesis before you size like a hero.
5. Let the Winner Become a Winner
This is where people sabotage the homerun.
They finally identify the outlier.
They buy it.
Make 15%.
Celebrate.
Sell everything.
Then watch the asset go another 300%.
If you are specifically hunting for asymmetric winners, your risk plan has to allow at least part of the position to run.
You cannot catch a homerun if every trade is automatically sold at first base.
6. Kill the Thesis When the Evidence Changes
Outlier status is not a lifetime membership.
Leadership changes.
Fundamentals deteriorate.
Competition arrives.
Valuation gets stupid.
Market structure breaks.
The same discipline that helped you identify strength must also help you recognize when that strength is gone.
Conviction Is Not Loyalty.
The market does not give anniversary gifts for holding a broken thesis.
What Is NOT an Outlier?
Not every asset showing short-term strength deserves the label.
Examples:
A dead coin pumping 70% on $40,000 of liquidity
A stock squeezing because half the float is short
A one-day meme narrative with no sustained demand
An asset that is “less down” only because trading activity disappeared
A chart that looks strong while the underlying business is actively melting
The whole framework depends on one important idea:
The strength has to mean something.
The Practical Answer
You Do Not Need to Predict the Next Star From Scratch.
That is the beauty of the outlier framework.
Instead of trying to be the smartest person in the room and predict which dead asset will be resurrected, let the market give you clues.
Watch what survives.
Watch what recovers first.
Watch what keeps growing while conditions are bad.
Watch what makes new highs while everyone is still arguing whether the bear market is over.
Think of it this way:
Bear Market:
What refuses to die?
Early Recovery:
What starts leading?
Bull Market:
Can I stay with the star player long enough?
The homerun does not come from buying the ugliest chart and hoping for a miracle.
It usually comes from recognizing unusual strength early, understanding why that strength exists, getting enough exposure for it to matter, and then having the patience not to interrupt your own winner.
Everybody loves the underdog story.
But whenever possible, pick the outlier.
For educational purposes only. Not financial advice. Markets can turn a star player into a benchwarmer faster than your group chat can type “buy the dip.”
Kind Regards,
Zeefreaks